Redesigning CaféWell's Navigation
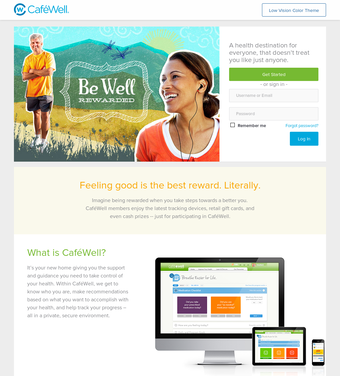
CaféWell is a health optimization platform that makes recommendations based on one’s health goals, tracks their progress in a private environment and provides constant motivation to succeed through a digital rewarding system
|
Goal - Evaluate the design, information architectures, workflow and menu structure of CaféWell's web application to improve website navigation, increase ease of learnability and strengthen users' confidence in Welltok's and CaféWell's brand
My role - Lead user research activities and design strategies (Setting goals and objectives, stakeholder interviews, planning and executing online card sorting, quantitative data analysis and synthesis, usability testing, recommendations and insight communication, wireframing, iterative prototyping) Stakeholders and collaborators - Product designers, visual designers, business analyst, product owner, project manager, service delivery managers Tools used - InVision Boards, Usertesting.com, Optimal Workshop, MS Excel |
The Problem
Through on-going qualitative research studies and a continuous feedback channel in the form of NPS ratings and comments, I decided to create a repository of usability issues that weren't, at the time, clear or being addressed. I looked for patterns that were repetitive across Welltok's client base and those that were directly related to active research questions, objectives and key results.
After several rounds of discussions with internal product and design teams, and face-to-face interactions with tier-1 clients, the following were prioritized as most concerning issues -
After several rounds of discussions with internal product and design teams, and face-to-face interactions with tier-1 clients, the following were prioritized as most concerning issues -
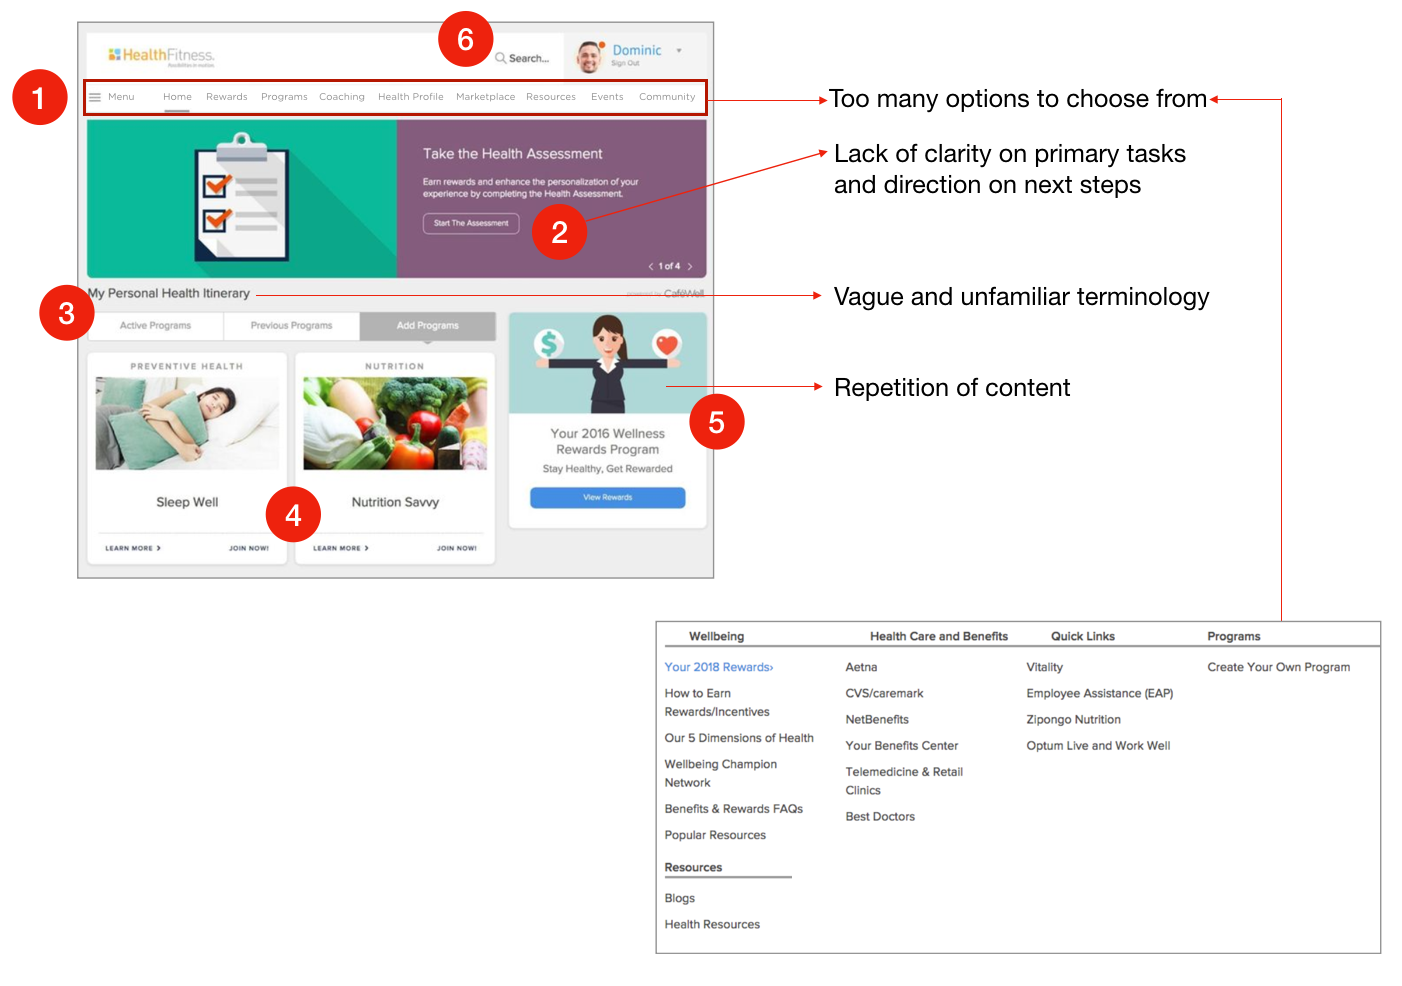
- Information overload - With too many options in the primary and secondary navigation bar, users had a hard time deciding which path to choose, lacked confidence and some of the menu items had low usage
- Unclear hierarchy - Due to outdated design strategies, pages were constructed without any knowledge of human reading patterns, size, space, color and typeface considerations. Moreover, many users also pointed at dead links/ processes that further confused their path
- Confusing terminology - Users pointed at use of inconsistent labels, leading to increase in cognitive load and a steep learning curve
The Process
- We started with creating an updated site map to explicitly list every page on the website and elaborate on current hierarchical structures
- A detailed card sorting exercise was conducted with more than 200 participants to identify site hierarchies and content priorities
- After wireframing and prototyping new design templates, guerrilla usability testing was conducted and I held a number of working sessions with clients to decide content direction and validate new and old user flows
High-Level Site Map Creation
- After demonstrating the complexity and (in certain parts) redundancy in the high-level site map, we learnt that giving clear access to most relevant content for individual users was of utmost importance
- I worked with one of our lead designers to create this foundational site map
- Recently added pages and those that hadn't been worked on in a while, were marked differently
- A summary of content, in the form of bullet points, was demonstrated for every page to highlight the amount of content and provide an opportunity to reflect on its relevance

Stage 1: Online Open Card Sorting - Planning & Execution
I decided to start with an open card sorting exercise on Optimal Workshop to watch participants sort various pieces of content into groups that made sense to them, and also provide labels to those groups. My goal here was to -
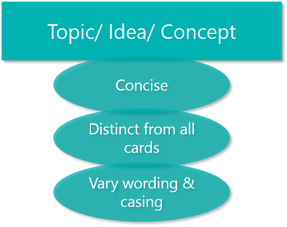
This exercise started by inventorying the content found on the most top layers of the website's information architecture, using a spreadsheet to capture details, versions and positions in the information hierarchy. The team and I went through several iterations to deliver most concise and distinct. Care was also taken to make sure the card language did not lead or influence participants on grouping.
- Understand users' mental model on how they conceptualize website information and therefore, want it to be structured
- Understand where people expect to find information when they are in the experience
- Get familiar with users' language
This exercise started by inventorying the content found on the most top layers of the website's information architecture, using a spreadsheet to capture details, versions and positions in the information hierarchy. The team and I went through several iterations to deliver most concise and distinct. Care was also taken to make sure the card language did not lead or influence participants on grouping.
|
|
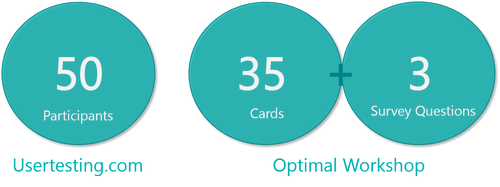
To follow card sorting best practices and include most important pieces of content we ended up with 35 cards for our users to sort - a manageable number.
Participants were recruited using usertesting.com's efficient and diverse database of users. We recruited "inexperienced users" or those who hadn't used CafeWell before, equally distributed across age (18-30, 30-45, 45-55+ years), gender (female, male) and geography (all 50 states of US). Participants' knowledge of digital healthcare and their current insurance statuses were taken into consideration.
As participants were recruited on usertesting.com, they were also filtered based on their knowledge of using Optimal Workshop.
Participants were also asked three questions in the form of a post-sorting questionnaire, to better understand their choices of sorting and labeling.
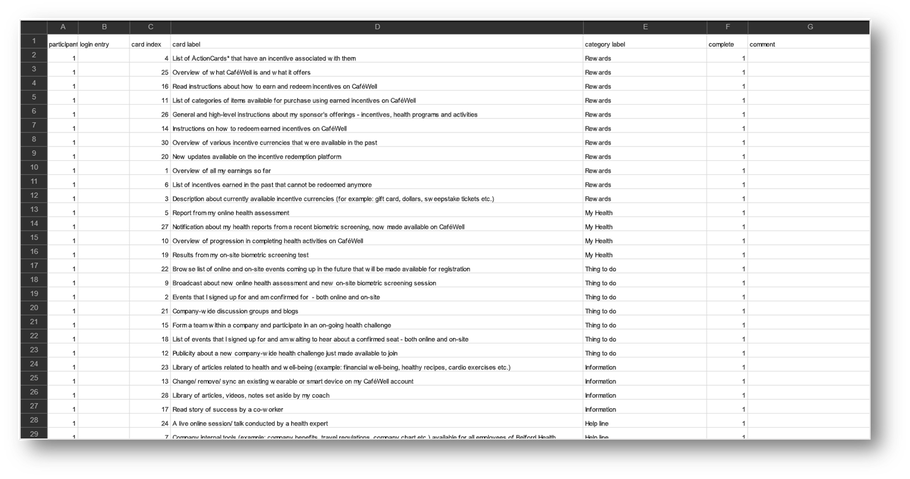
Sample data from anonymous participant - Optimal Workshop
Stage 1: Online Open Card Sorting - Analysis
The closed card sorting exercise was conducted after completing open card sorting, to incorporate results from it. We examined the group names that users had created, which were repetitive and also occurred in most similar groupings (Optimal Workshop generates a data report called "Similarity Matrix" to better analyze such patterns)
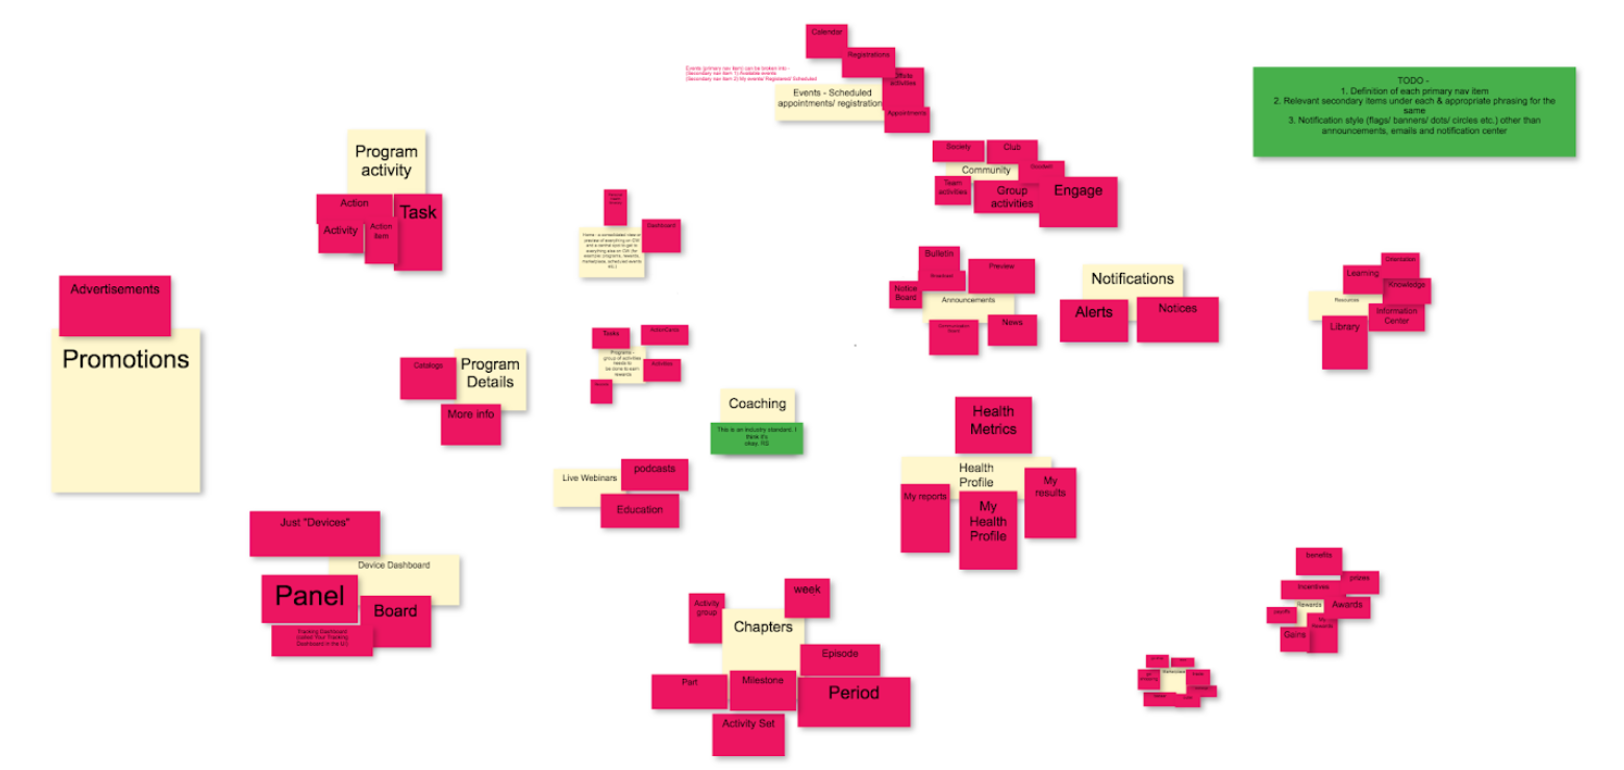
While some of the data was scattered, most users pointed at how certain type of data could fall under very specific categories. For example: "Library of articles, videos, notes set aside by coach", "General or high-level instructions for spouse healthcare coverage", "instructions about earnings on CafeWell" etc. could fall under something similar to "Resources" or "Education" or "Things to Do". "Results from Biometric Screening Test", "Reports from Online Health Assessment", "Feedback from Health Coach" etc. could fall under "Data" or "Reports" or "Your Health".
We also saw some participants interchange use of similar labels/ categories, but for different cards - informing us about areas that confuse users and providing opportunities for correction, elimination and merging of site content.
Most interestingly, we saw users play with the use of verbs and nouns (example: Health Tracking vs My Health) and using the word "My" for every card like "My Resources", "My Coach", "My Community" etc.
Therefore, after this exercise we had reduced the originally existing 11 categories to 9, and we also had 9 brand new names for each of those categories.
There was still work to be done to verify these results, which led to the closed card sorting exercise.
Stage 2: Online Closed Card Sorting - Planning, Execution & Analysis
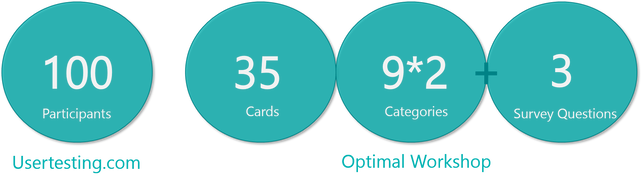
Next, we conducted a slightly more extensive round of closed card sorting with two groups of users, with the recruiting criteria being the same - "inexperienced users" or those who hadn't used CafeWell before, equally distributed across age (18-30, 30-45, 45-55+ years), gender (female, male) and geography (50 states of US).
One of the groups of participants got cards and categories based on existing website terminology and structure. The second group got the same cards with new category labels to sort through (coming out of the open card sort results).
The goals of this exercise -
One of the groups of participants got cards and categories based on existing website terminology and structure. The second group got the same cards with new category labels to sort through (coming out of the open card sort results).
The goals of this exercise -
- Understand how people agree/ disagree with the structuring of current categories and information
- Discover misleading or irrelevant or redundant categories
- Essentially, further reduce the number of categories from where we started
While some of the results were expected, some were not. We learnt -
- The importance of personalizing information is truly personal (like health data, digital rewards, disease-related information etc.)
- Users' priorities when it comes to using the application, learning about healthcare in the US, changing their lifestyle and earning rewards
- Users do not consider community and education information to be on the same level as health programs and rewards (primary vs secondary level information)
- Opportunities of combining categories like - announcements+notifications+events, resources+community
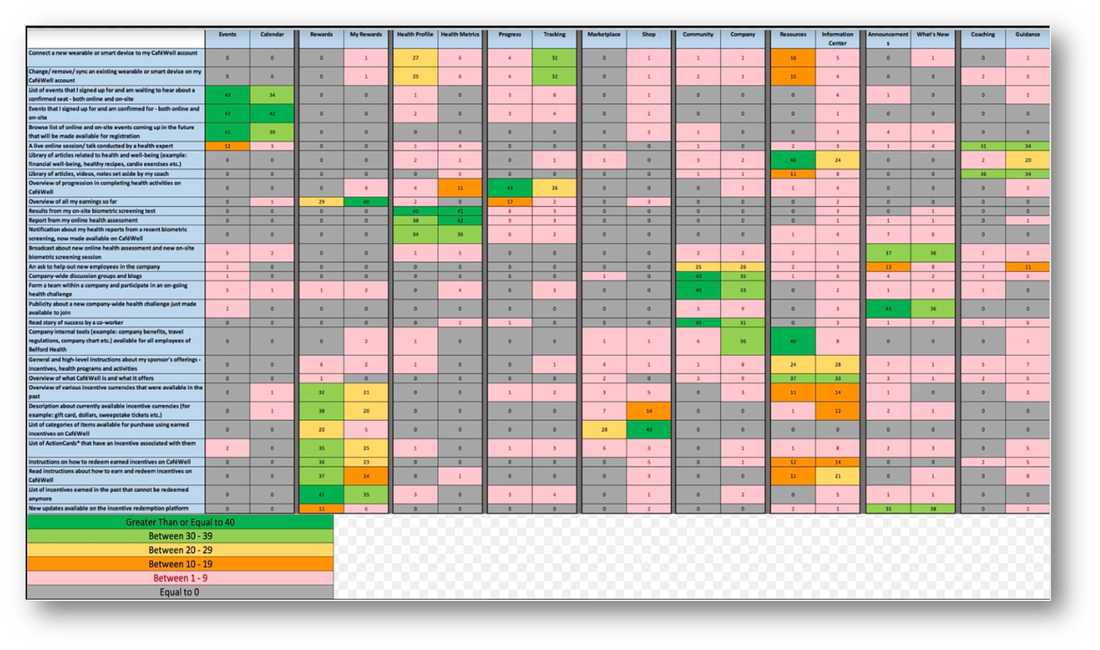
Consolidated data from closed sorting exercise - MS Excel
Surprising Feedback
Not only did we discover opportunities to remove redundancy and improve consistency in language and structuring, we also learnt about -
- Gaps in existing configuration mechanisms
- Next steps in redesigning marketing content
- Ideas for mobile content with a cross-reference to web content
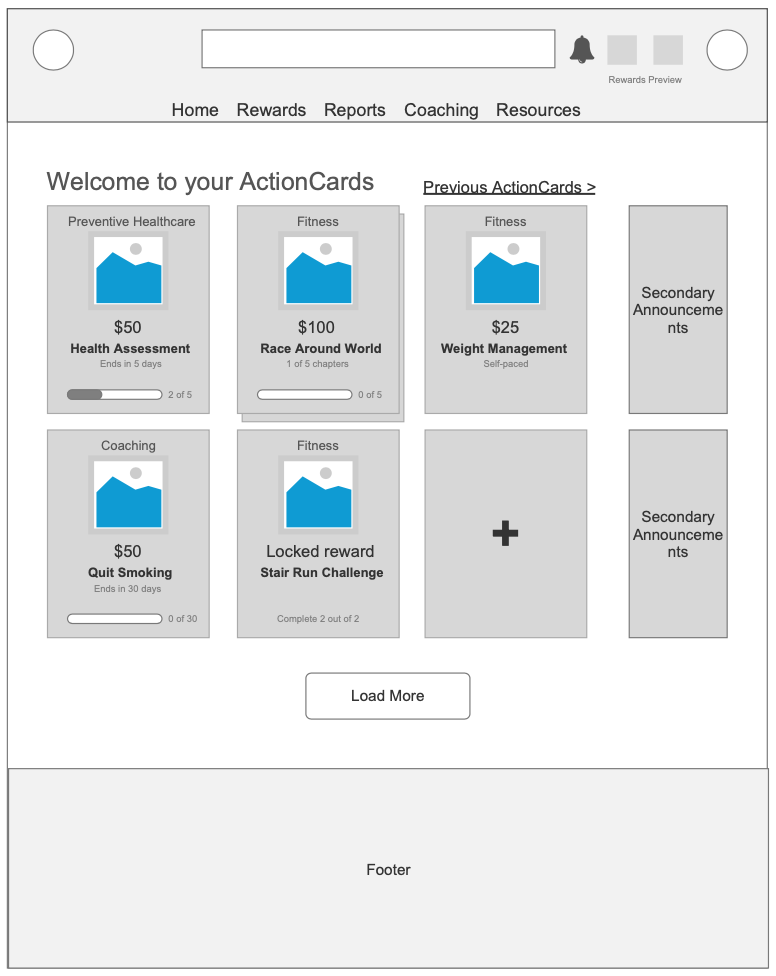
Wireframing
|
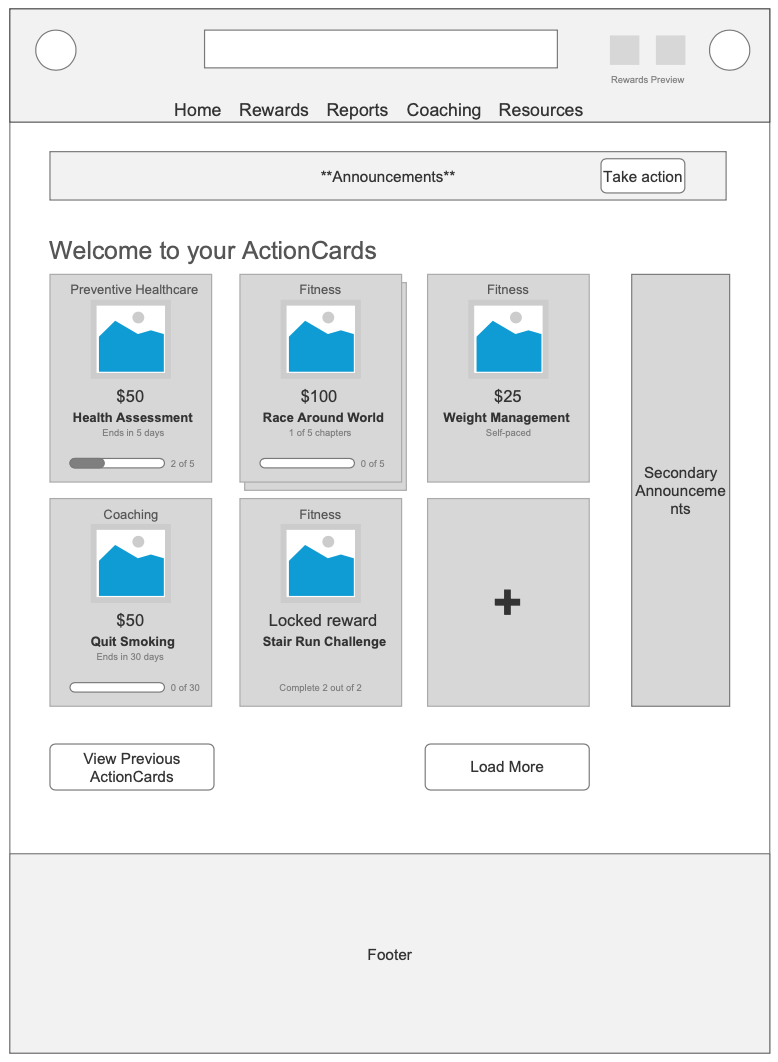
1. A reduced primary navigation bar
2. Horizontal secondary navigation items 3. Better focus on interacting with ActionCards (previously called "Programs") 4. Promotions and announcements de-emphasized 5. Making "Previous ActionCards" a secondary action item |
|
|
|
|
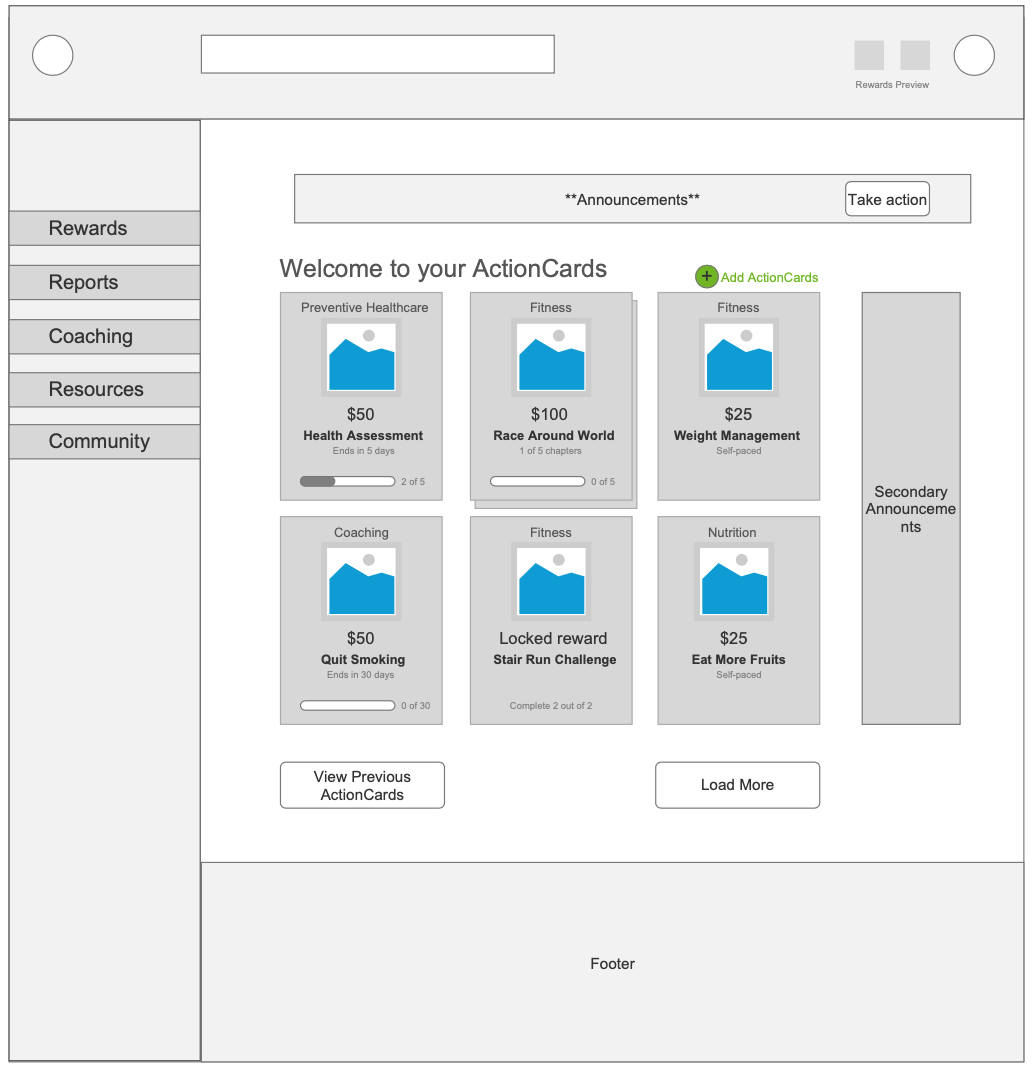
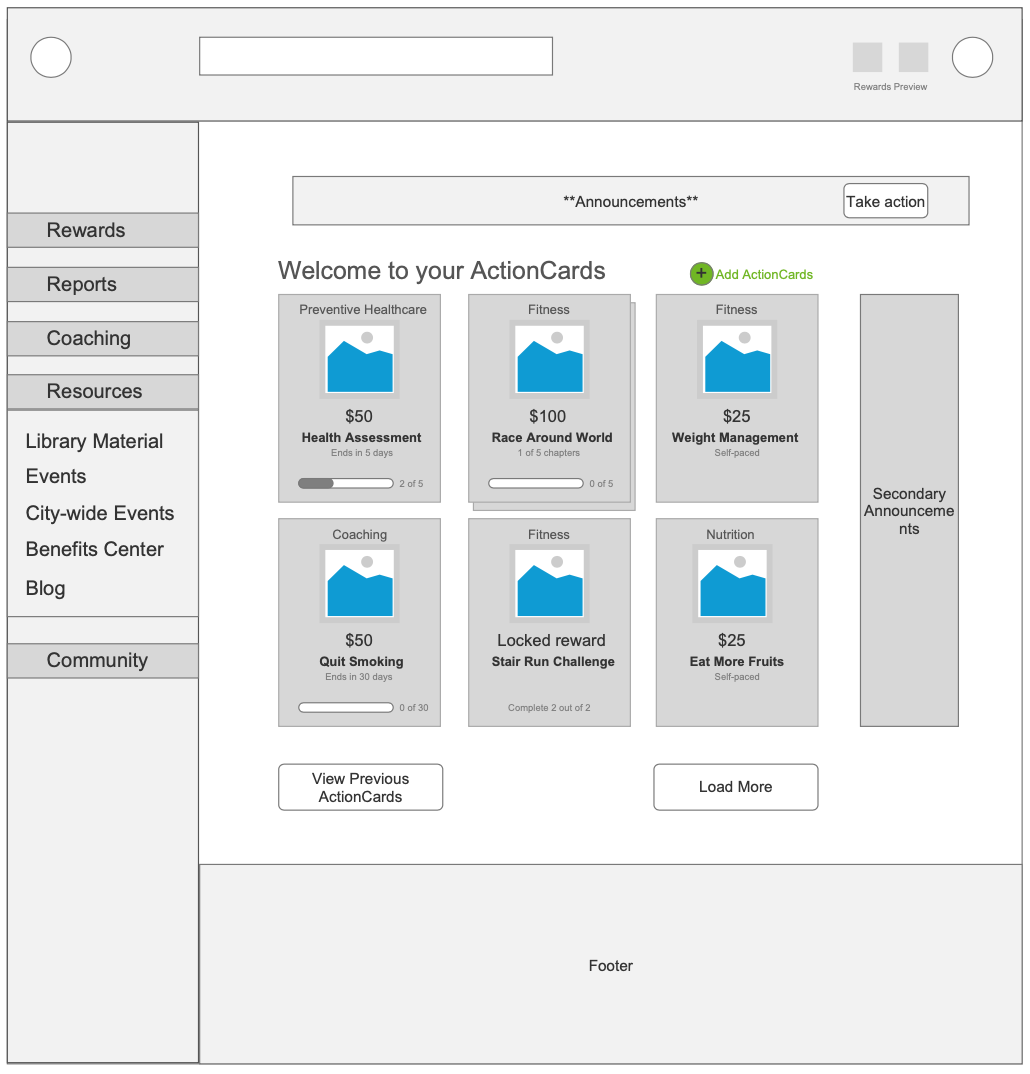
1. A reduced vertical primary navigation bar
2. In-space expansion of vertical secondary menu items 3. Better focus on interacting with ActionCards (previously called "Programs") 4. Promotions and announcements de-emphasized 5. Making "Previous ActionCards" a secondary action item 6. Using icon(s) to draw attention to adding new cards, rather than equalizing alongside primary ActionCards |
|
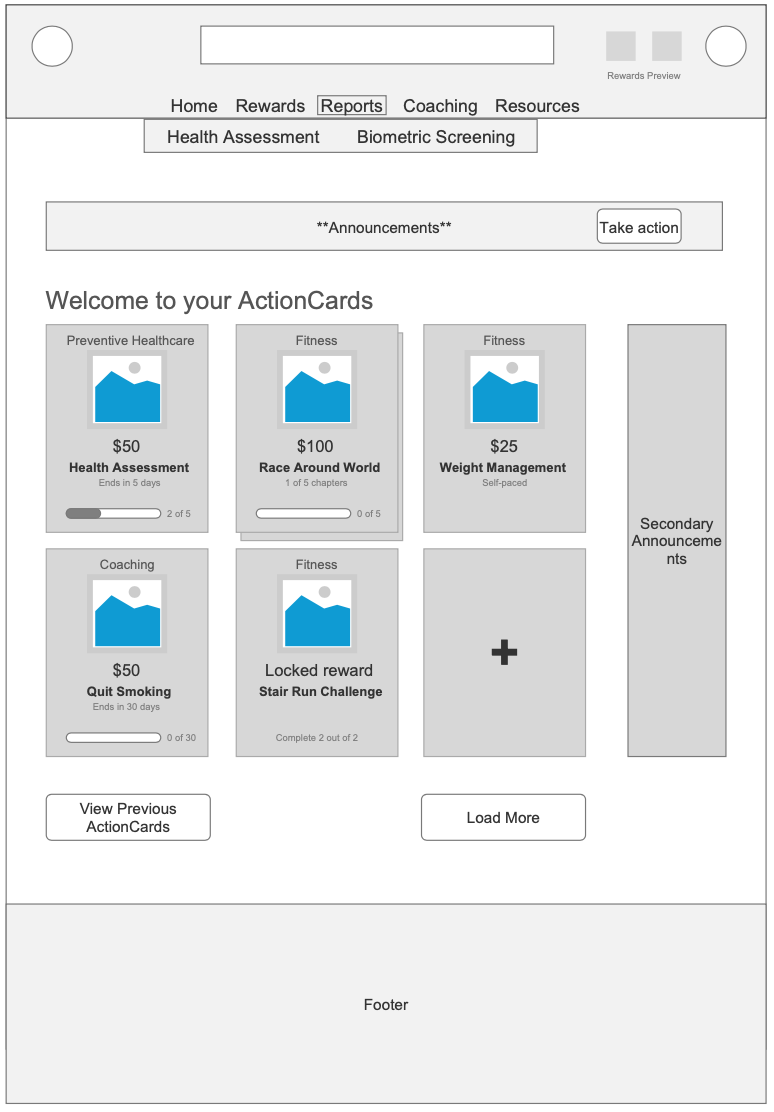
1. A reduced primary navigation bar
2. Horizontal secondary navigation items 3. Better focus on interacting with ActionCards (previously called "Programs") 4. Promotions and announcements de-emphasized by removing the banner and using a bell icon to indicate any new announcements 5. Making "Previous ActionCards" a secondary action item |
Guerilla Usability Testing
Using the wireframes, a quick test was conducted to gather feedback on change in terminology and structure. I proceeded with interviewing a few users in and around the office area to get initial feedback on the changes, as I walked them through each of them. We decided to go with a small number of users (5) as we were looking for qualitative data, upfront.
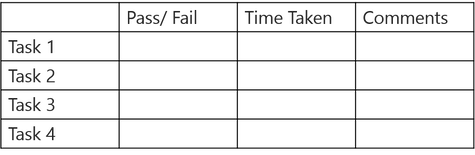
Each participant was interviewed for 15 minutes and was given 4 simple tasks to perform.
Note: This would be followed by other design iterations to deeply investigate visual representation of content (text, images, marketing data, numbers, typography, colours etc.)
Each participant was interviewed for 15 minutes and was given 4 simple tasks to perform.
Note: This would be followed by other design iterations to deeply investigate visual representation of content (text, images, marketing data, numbers, typography, colours etc.)
Design Explorations & Impact
We started off with the goal of redesigning CafeWell's user experience to better facilitate the process of understanding the application, using its most important features and earning rewards from it (implicit and explicit).
Using a combination of user research techniques (with more to come), we streamlined the navigation for our users in accessing information on (a) health programs/ ActionCards, (b) rewards, (c) health profile, and (d) coaching.
This resulted in -
Using a combination of user research techniques (with more to come), we streamlined the navigation for our users in accessing information on (a) health programs/ ActionCards, (b) rewards, (c) health profile, and (d) coaching.
This resulted in -
- Increased satisfaction among customers and consumers (different feedback channels for clients and end-users)
- Within a period of 30 days, the NPS score for one of the clients went from -2 to 11 (highest for us that quarter)
- Increased task completion rate as demonstrated by live web analytics
- A massive win for the Product and UX team at Welltok, in helping the company understand and follow UX configuration guidelines (find document here)
Final Design
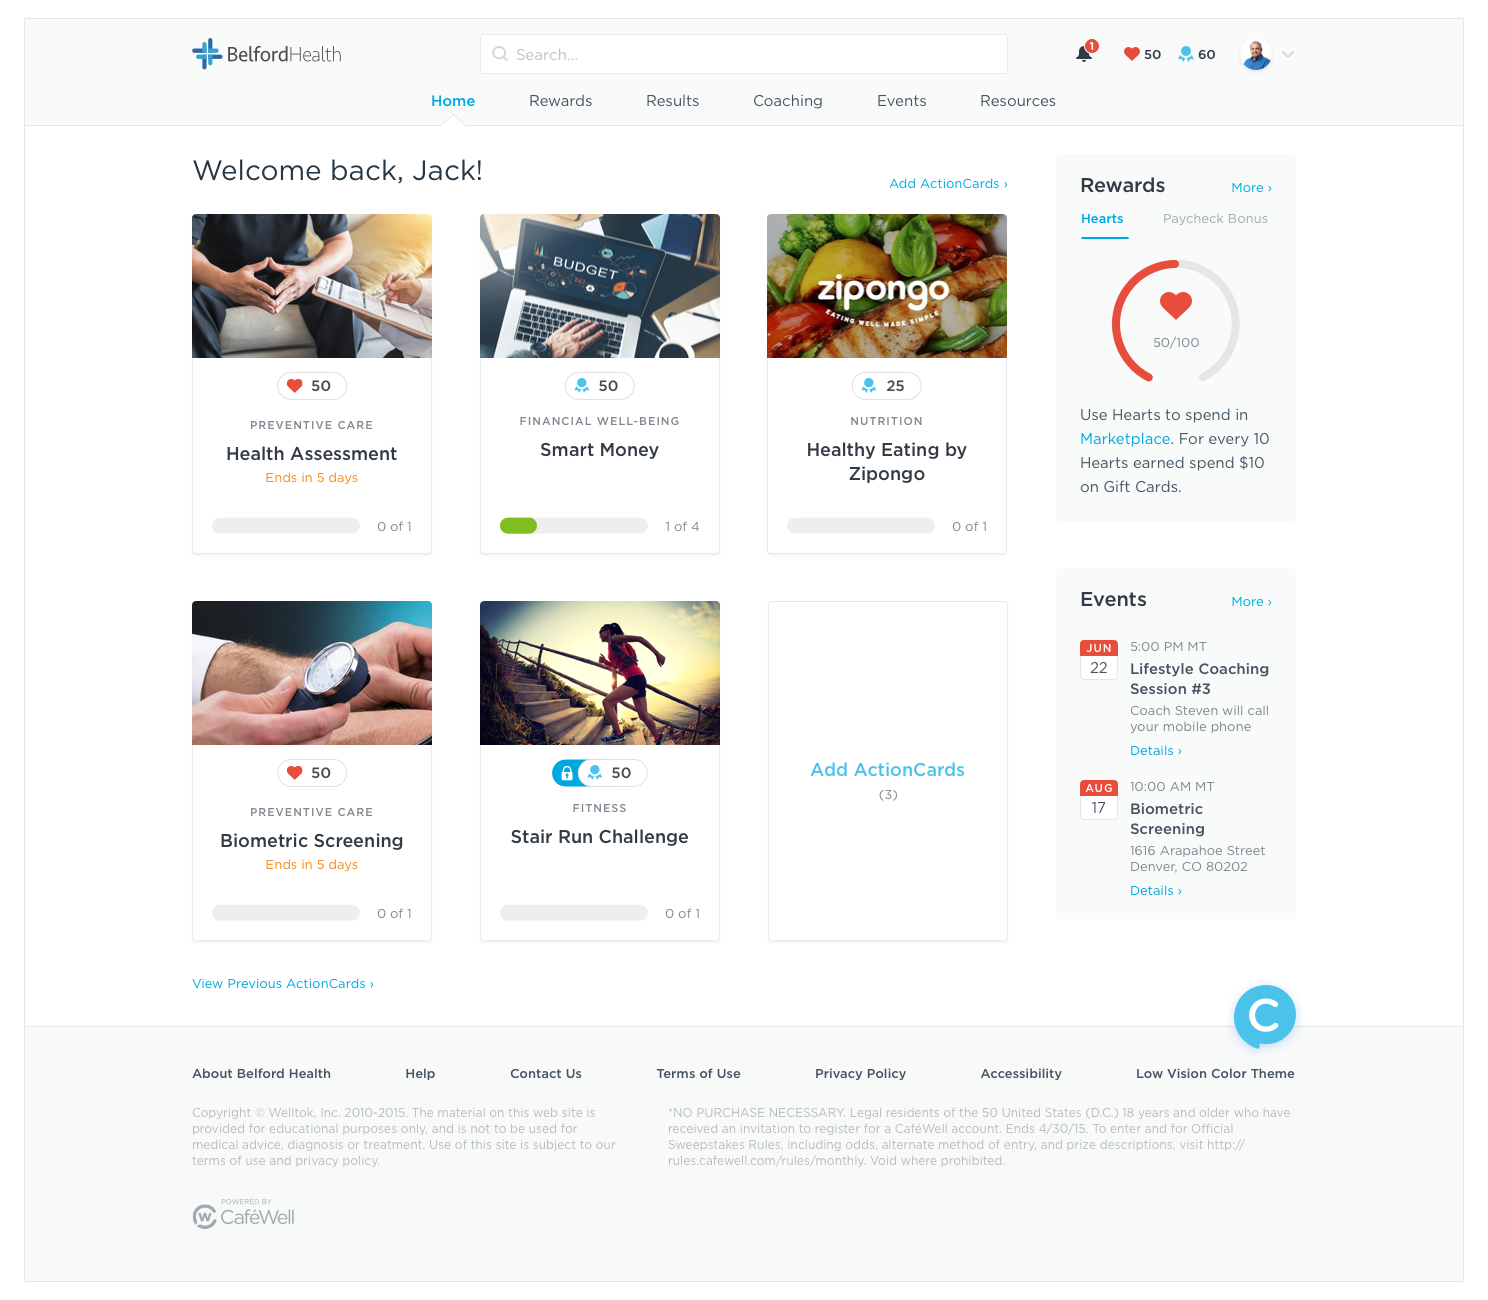
|
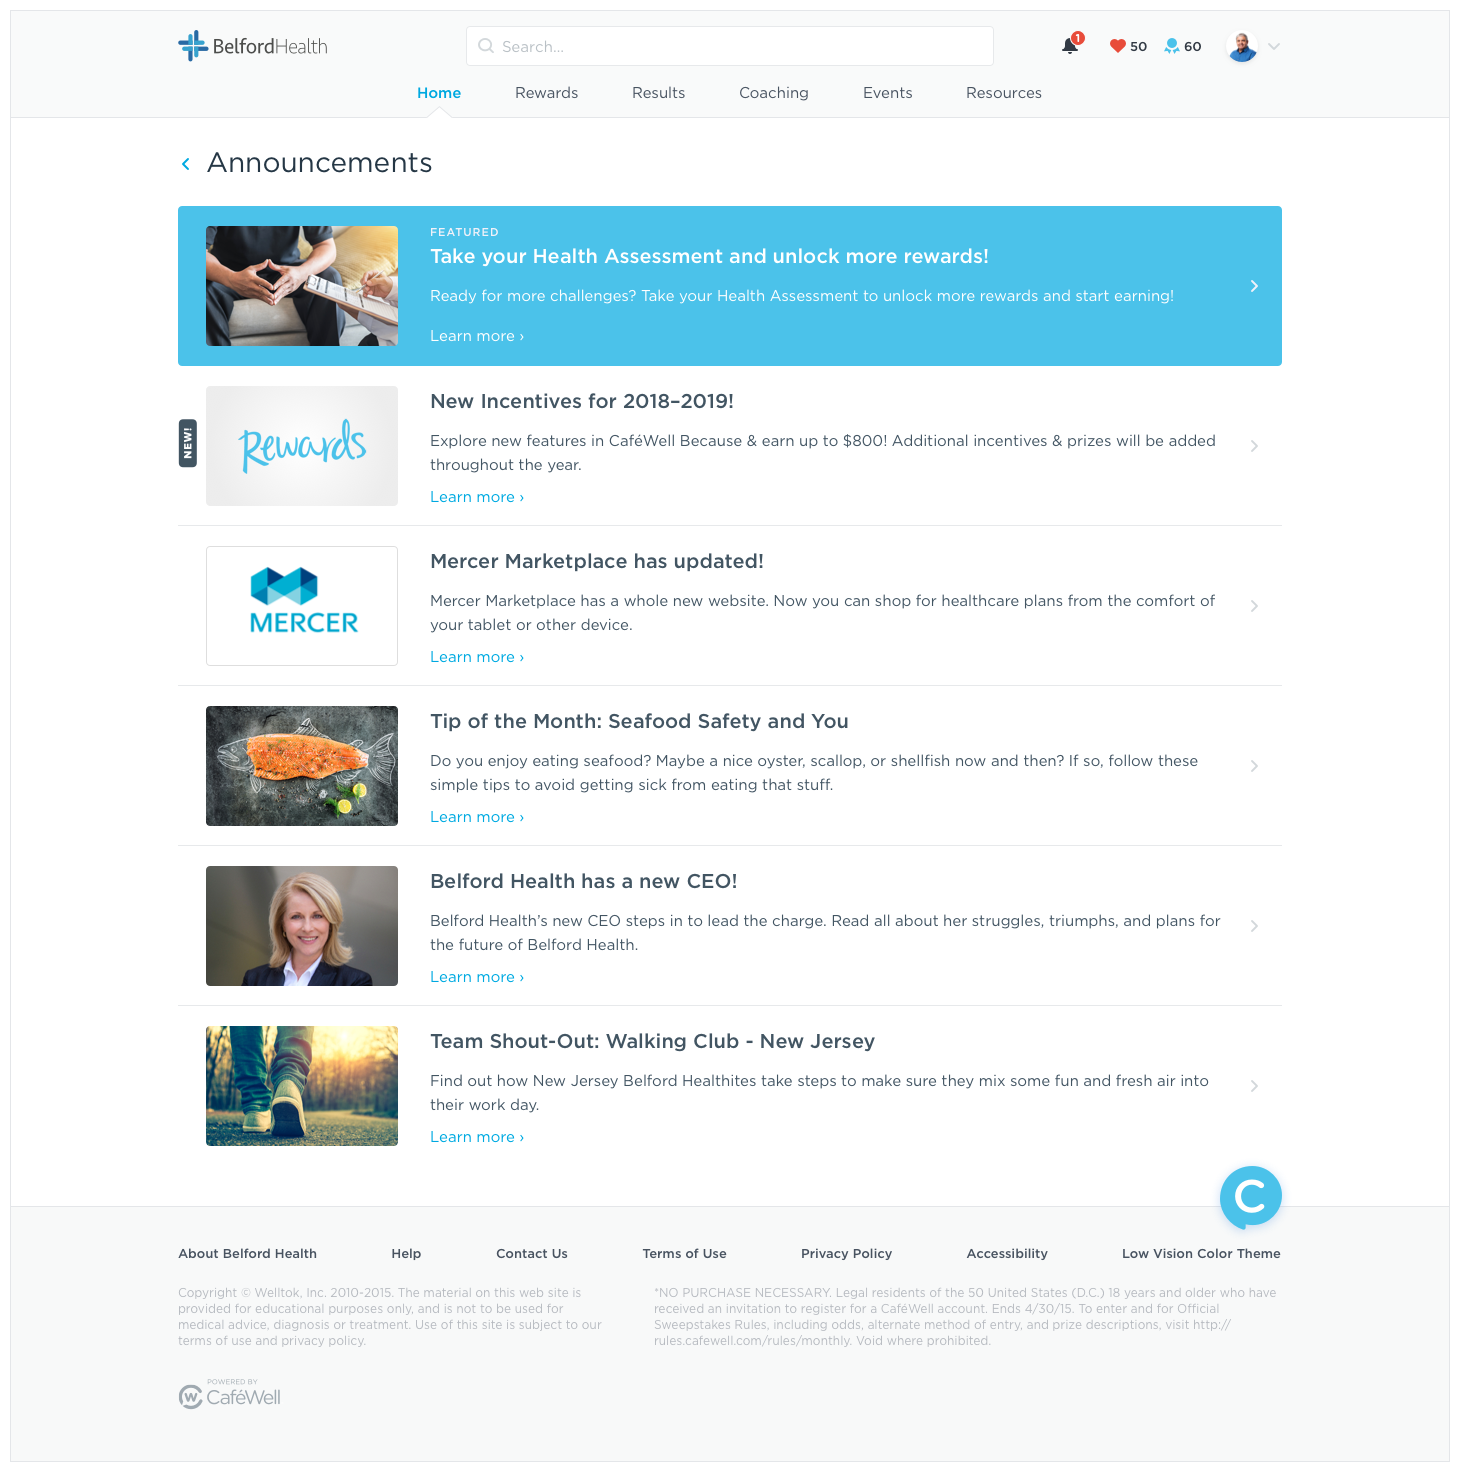
|
Future Steps
- More usability testing on organization of information across the website, diving deeper into unique items each time
- Tie content exploration results with visual design exploration exercises (case study coming soon)
- Build on configuration and content creation best practices to keep the NPS score high
- Explore user intentions for different groups of people and tie with content creation
- Continue helping clients understand importance of data outside of NPS
